A strong senior living marketing budget starts with occupancy, not last year’s line items. Set move-in targets by community and care type, work backward to the qualified inquiries you need, then fund the work most likely to close the gap.

That sounds simple. In practice, most 2027 budgets will still be built from a percentage of revenue or a channel-by-channel rollover. This post walks through a better approach, drawn from Volume 3 of Fountain Digital’s Executive Insights series, Building a Marketing Budget That Drives Growth.
The short answer: to build a senior living marketing budget that drives growth:
- Define the occupancy and move-in results the budget must support, by community, care type and month.
- Subtract existing pipeline and referrals, then calculate the qualified inquiries needed to reach the remaining move-ins.
- Multiply by a realistic, fully loaded cost per qualified inquiry.
- Give every major investment a decision: increase, improve, test or reduce.
- Measure results with a shared executive scorecard and a finance-approved ROMI calculation.
Why a percentage-of-revenue budget falls short in senior living
No single percentage fits every senior living community, because occupancy, inventory and demand vary sharply by market. A community near capacity needs a different plan than one in lease-up or recovering from a sudden occupancy drop.
The market data makes this clear. Senior living occupancy reached 90.4% in Q3 2026 across the 31 primary markets NIC MAP tracks, and 16 of those markets were at or above 90%. Construction is not keeping up: NIC estimates the industry is developing about 10,445 units a year, roughly a tenth of what would be needed to hold occupancy at 90% as the population ages.
That sounds like a reason to spend less. It isn’t. Results still vary widely by market, and a full community can change quickly. One assisted living community Fountain Digital supports fell from full occupancy to about 80% in a single month. Its paid media plan shifted from maintenance to recovery within weeks.
Generic benchmarks offer little help. Gartner’s 2026 CMO Spend Survey put marketing budgets at 7.8% of company revenue, but most respondents came from companies with more than $1 billion in annual revenue. Plan around local availability and demand, not a universal percentage or a fixed allocation by channel.
Every senior living marketing budget should establish three things:
- A business objective: the occupancy, move-in and financial results the investment must support.
- An investment rationale: the performance evidence, execution gap or testable opportunity behind the request.
- A review decision: who will evaluate results, and what would justify increasing, improving or reducing the investment.
Four questions to answer before your marketing budget is approved
Before approving any senior living marketing budget, leadership should be able to answer four questions: what outcomes we need, what has worked, what is limiting progress, and what would make us change course.
1. What business outcomes do we need?
Set objectives by community, care type and month. Account for expected departures, available residences and the operational capacity to welcome new residents. Timing matters too: the same year-end occupancy can produce different annual revenue depending on when move-ins occur.
Bring Finance and Operations in early. Confirm whether the priority is a lease-up, replacing expected departures, filling a particular unit type or improving the economics of acquisition.
2. Which investments produced useful results?
Review costs alongside qualified inquiries, completed tours and move-ins, and follow prospects long enough to see progression. Senior living decisions take longer than most dashboards admit. Six weeks after one community increased its budget, tours were flat. At sixteen weeks, they had doubled.
Choose your comparison period deliberately. One Fountain Digital client community saw paid leads fall 35% against a prior period that had been among its strongest ever, while year-over-year results rose. Same data, different headline.
3. What is limiting progress?
Match the fix to where prospects stall:
- Prospects aren’t finding you: investigate visibility and acquisition.
- Inquiries arrive but tours don’t follow: examine lead quality, response time, scheduling and nurturing.
- Tours don’t lead to move-ins: review availability, pricing, fit and the visit experience with Sales and Operations.
Volume can hide the real problem. In one community, paid leads held nearly steady (down 4.5%) while tours fell 61.5% and move-ins dropped from nine to one. The fix was tighter geographic targeting, audience exclusions and refreshed creative, while holding or reducing added budget until lead quality improved. This review should also surface spending to challenge: duplicate tools, unused services, unsuitable inquiries and contracts that no longer support a priority.
4. What would make us change the plan?
Require a baseline, target, owner, review date and decision rule for each major investment. For new initiatives, agree on a spending limit and the evidence needed before expansion.
Before approval: ask each investment owner to complete this sentence: “We propose this investment to address ___, will evaluate it using ___, and will revisit funding when ___.”
How to calculate your senior living marketing budget from move-in goals
To calculate a senior living marketing budget, work backward: move-ins needed from new inquiries ÷ qualified-inquiry-to-move-in rate × cost per qualified inquiry. Every value below is hypothetical; replace each one with your own assumptions.
Step 1: Estimate the acquisition requirement
| Planning input | Illustrative calculation |
|---|---|
| Inventory and starting occupancy | 100 rentable units; 85 occupied at the start of 2027 |
| Year-end target | 92 occupied units, a net gain of 7 |
| Expected departures | 24 occupied units become vacant during the year |
| Required unit-filling move-ins | 7 for growth + 24 replacements = 31 |
| Existing pipeline and other sources | 11 expected move-ins, counted without overlap |
| Remaining requirement | 31 − 11 = 20 move-ins from new marketing inquiries |
Step 2: Convert move-ins into inquiries and dollars
At an assumed 10% qualified-inquiry-to-move-in rate, 20 move-ins require 200 qualified inquiries. At $300 per qualified inquiry, the starting program estimate is $60,000.
For calibration, media-only cost per lead in Fountain Digital’s paid search accounts this year has ranged from roughly $130 to $275 once campaigns matured. Qualification and fully loaded costs push the real figure higher.
Step 3: Stress-test the conversion rate
Is 10% realistic? It depends on care type and on what counts as “qualified.” Raw paid search leads convert lower: across five Fountain Digital communities this summer, about 3 in 100 became move-ins within an 11-week window, with some tours still in progress.
| Qualified inquiry-to-move-in rate | Qualified Inquiries needed | Program estimate at $300 each |
|---|---|---|
| 10% | 200 | $60,000 |
| 8% | 250 | $75,000 |
| 6% | about 334 | $100,000 |
Improving conversion can matter as much as increasing spend, though a sensitivity table can’t predict when an improvement will happen.
Step 4: Build the complete investment request
Define what the $300 includes, then add costs outside that scope: shared technology, internal labor, website work, creative production, reporting and testing. Separate recurring costs from one-time projects, show when cash is needed, and count each cost once.
Fees count too. In one portfolio, every $833 of incremental spend carried $167 in management fees, so the fully loaded cost per lead ran 20% higher than the media-only figure.
Finally, build conservative, base and growth scenarios, and reconcile the model monthly. Inquiries must arrive early enough to convert, and residences must be available when prospects are ready. These are planning estimates, not measured incremental returns
The executive scorecard: senior living marketing metrics that tie to occupancy
Use a small set of measures that connects spending to prospect progress and business results. For each one, show actual performance, target, comparable prior results, reporting period and the person responsible for action.
| Measure | Definition for Consistent Reporting |
|---|---|
| Qualified inquiries | Unique prospective-resident opportunities that meet agreed service, location, financial and timing criteria. Link family contacts to the same opportunity. |
| Cost per qualified inquiry | Defined acquisition costs ÷ qualified inquiries from the same source and period. Label media-only and fully loaded figures separately. |
| Tours and conversion | Report tour requests and completed tours separately. Measure inquiry-to-tour and tour-to-move-in within the same prospect group and observation window. |
| Marketing-sourced pipeline | Open qualified opportunities assigned to marketing under a documented source rule. Estimated pipeline value is a forecast, not revenue. |
| Sourced and influenced move-ins | Report source-assigned move-ins separately from those with documented marketing interactions. The groups overlap and must not be added together. |
| Financial contribution and ROMI | Show realized and projected contribution separately. Report incremental return only when the measurement supports it. |
Make the numbers comparable
Segment results by community and care type before drawing portfolio conclusions. Show occupancy, available inventory and net occupied-unit change as context. Flag unknown sources and incomplete records instead of quietly assigning credit.
Don’t divide this month’s move-ins by this month’s new inquiries and call it a conversion rate. Follow a defined group of inquiries over time, because many move-ins originate in earlier periods.
Totals can mislead. Across five communities given added paid search budget this summer, paid leads rose 6% compared with the prior period, tours slipped 4%, and move-ins fell from 19 to 11. Some move-ins may still arrive, but a report that stopped at leads would have called it a good summer.
Platforms can help close the loop. Google Ads supports qualified and converted lead goals that use offline outcomes recorded in your CRM, so campaigns can be evaluated on more than form submissions. Platform capability is not a guaranteed performance gain, though. Your CRM and financial records should remain the reconciled basis for executive reporting.
How to calculate senior living marketing ROI (ROMI)
Return on marketing investment (ROMI) measures the additional financial contribution an investment generates, net of its cost. The Universal Marketing Dictionary defines it using incremental revenue, contribution margin and marketing spend.
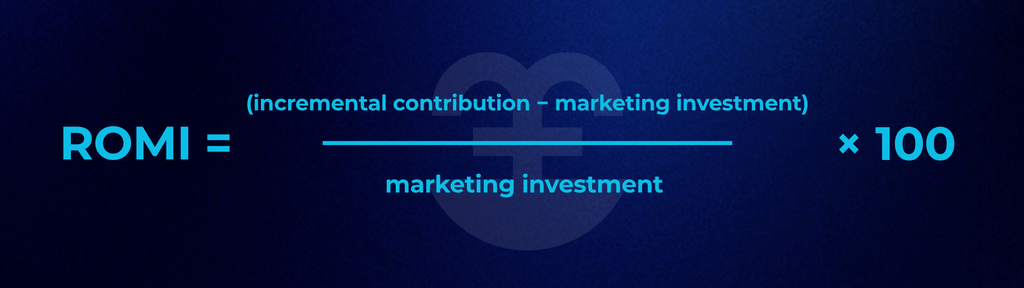
Finance should define contribution after relevant delivery costs and concessions, but before the marketing investment. Agree on the cost scope and evaluation window up front. Attributed revenue divided by ad spend is ROAS, and ROAS does not establish profit return.
A planning example
Assume a $30,000 initiative is projected to generate eight additional move-ins, each contributing $1,500 per occupied month for six months within the evaluation window.
| Scenario | Additional Move-ins | Incremental Contribution | Projected ROMI |
|---|---|---|---|
| Plan | 8 | 8 × $1,500 × 6 = $72,000 | ($72,000 − $30,000) ÷ $30,000 = 140% |
| Shortfall | 3 | 3 × $1,500 × 6 = $27,000 | ($27,000 − $30,000) ÷ $30,000 = −10% |
At least four additional move-ins are needed to exceed break-even. This is a hypothetical sensitivity analysis, not a client result or forecast.
Separate attribution from incrementality
- Attribution assigns credit to interactions in a prospect’s journey.
- Incrementality estimates what happened because of the investment, beyond what would have happened without it.
The difference matters. A peer-reviewed study of 663 Facebook advertising experiments (Gordon, Moakler and Zettelmeyer, Marketing Science, 2023) found that the observational methods studied could not reliably recover the true causal effect of ads. The authors disclose Facebook/Meta affiliations, and the study is not a senior living benchmark, but it supports caution about causal claims.
Use controlled tests when you have enough volume and observation time. When evidence is limited, report attributed outcomes and scenario estimates with their assumptions. Before crediting marketing with an occupancy change, consider seasonality, pricing, availability, staffing and departures.
A 2027 senior living marketing budget calendar
| Month | Action |
|---|---|
| October 2026 | Review completed periods, forecast remaining move-ins and identify funding changes. Reconcile assumptions with Finance, Sales and Operations. |
| November 2026 | Finalize scenarios, contracts, capacity and testing funds. Resolve the assumptions that could materially change the budget. |
| December 2026 | Confirm campaign assets, tracking, follow-up responsibilities and January readiness. Schedule the first performance review. |
Maintain the plan throughout 2027
| 2027 Quarter | Leadership Focus | Output |
|---|---|---|
| Q1 | Validate assumptions and reporting; review early execution and mature prospect groups | Updated forecast and corrective actions |
| Q2 | Evaluate conversion, costs and tests with sufficient observation time | Evidence-based reallocations |
| Q3 | Develop 2028 scenarios from community needs, results and resources | Proposed 2028 investment plan |
| Q4 | Finalize 2028 funding and prepare first-quarter execution | Approved plan and assigned owners |
Set a review rhythm: Marketing and Sales review inquiry quality, follow-up and availability weekly. Leadership reviews results, spending, forecasts and actions monthly. Allocation and business assumptions get reassessed quarterly.
Keep a short decision record of what changed, why, who owns the action and when results will be reviewed. A meeting without a next step is just a calendar event.
Frequently asked questions about senior living marketing budgets
There is no reliable universal percentage. Gartner’s 2026 average of 7.8% of revenue comes mostly from companies over $1 billion in revenue. Instead, calculate the move-ins you need from new inquiries, divide by your qualified-inquiry-to-move-in rate, and multiply by your fully loaded cost per qualified inquiry.
Start with your year-end occupancy target and expected departures to find the required move-ins. Subtract move-ins expected from existing pipeline and referrals. Divide the remainder by your conversion rate to get qualified inquiries, then multiply by cost per qualified inquiry and add technology, labor, creative and fees.
It depends on care type and how you define “qualified.” A 10% qualified-inquiry-to-move-in rate is a reasonable planning starting point, but raw paid search leads convert lower; in five Fountain Digital communities, about 3 in 100 became move-ins within 11 weeks.
Report qualified inquiries, cost per qualified inquiry, tours and conversion, marketing-sourced pipeline, sourced and influenced move-ins, and financial contribution with ROMI. Segment each by community and care type.
ROAS divides attributed revenue by ad spend. ROMI subtracts the marketing investment from incremental contribution, after delivery costs, and divides by the investment. Only ROMI indicates profit return.
Long enough for prospects to move through the decision. In one Fountain Digital community, tours were flat six weeks after a budget increase but had doubled by sixteen weeks. For organic search, Google’s SEO Starter Guide notes that changes can take anywhere from hours to several months to show up.
Get the full 2027 budget planning guide
A good budget tells leadership where the money goes, what it should accomplish and what the team will do when results don’t match the plan.
The complete guide, Building a Marketing Budget That Drives Growth, includes the full planning model, funding framework, executive scorecard, ROMI example and a printable 2027 budget planning checklist to use with Marketing, Sales, Finance and Operations.
You’ll also see how to decide which investments to fund for the problem you need to solve, and how to assign each one a clear decision: increase, improve, test or reduce. The guide includes real examples of when Fountain Digital recommended sustaining, holding or cutting spend, and what the evidence showed.
Fountain Digital brings digital marketing, website development, analytics and email automation under one roof. Our Fonterra Engine™ connects marketing and CRM data, so website, search, paid media and nurture work can be evaluated together with a clearer view of inquiry quality and progression. For 2027 planning, schedule a complimentary Marketing Strategy and Budget Planning Session and bring your community priorities, current channel spending and conversion reports.
New to our Executive Insights Guide Series? Start with Volume 1: Building a High-Performance Growth Engine and Volume 2: Senior Living Marketing Performance.